- Turning a Workstation into a Data Source
- Separating Data Acquisition from Data Presentation
- Creating a Common Asset Model
- Coordinating Data Collection
- Integrating with Industrial Systems Using MQTT Sparkplug B
- Engineering Challenge: When the Data Only Publishes Once
- Working with Hardware-Specific Limitations
- From Workspace Collector to Workspace Explorer
- What This Project Demonstrates
- Building Solutions Around Real Data
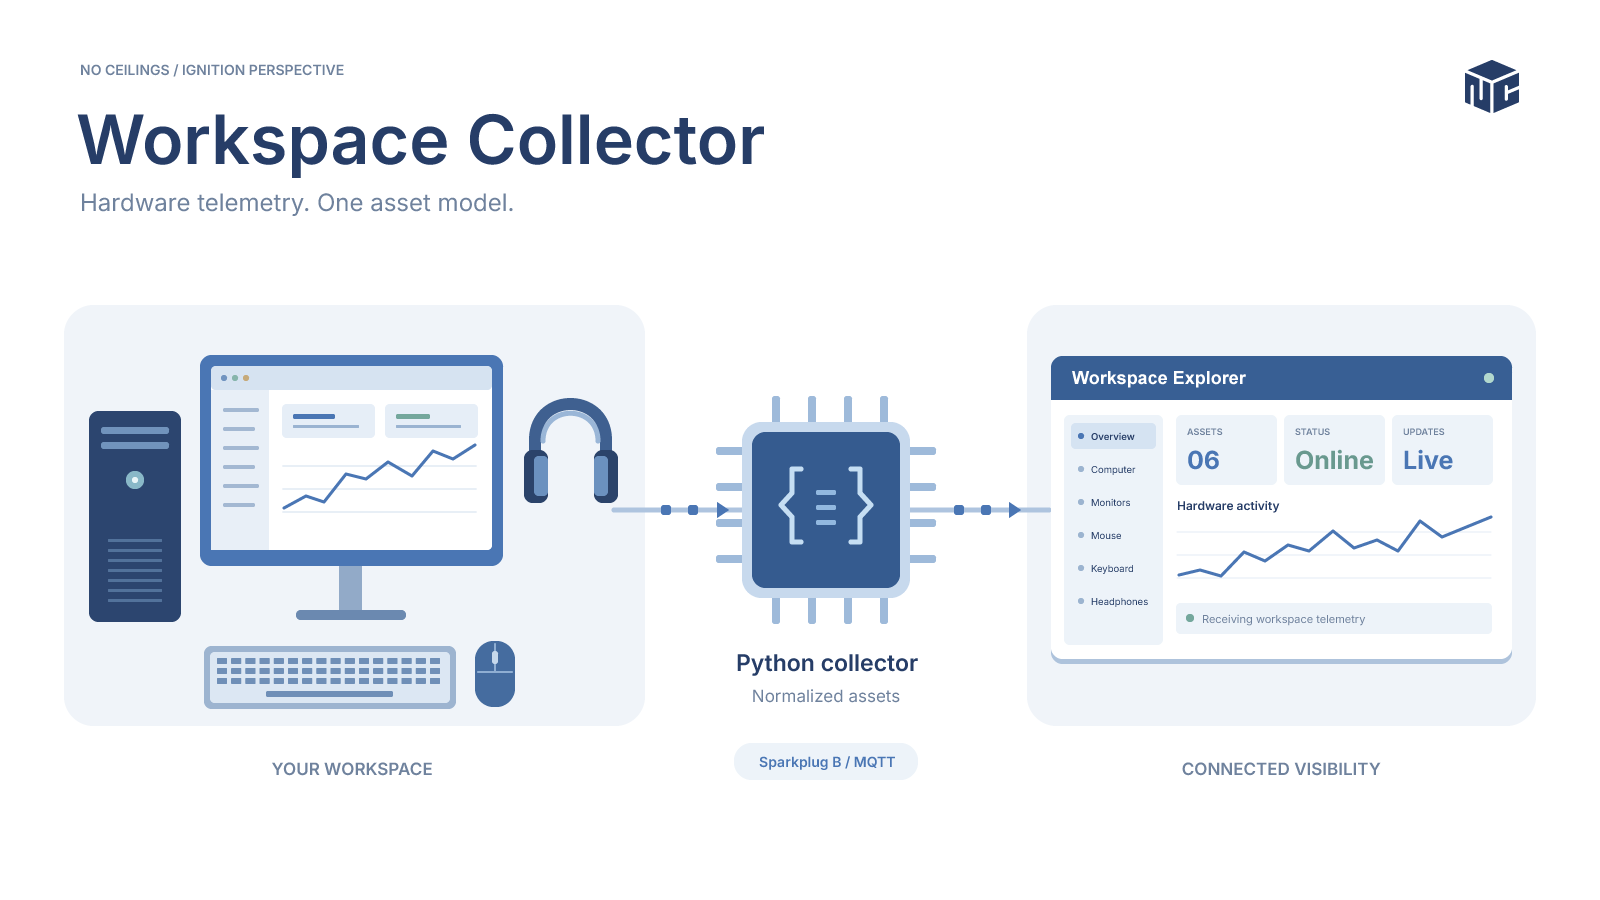
At No Ceilings, we develop HMIs that help operators and engineers monitor equipment, understand operating conditions, and interact with industrial processes. But demonstrating those capabilities presents an interesting challenge: what do you monitor when you don’t have a production line sitting in your office?
We could simulate equipment, generate arbitrary process values, and build a dashboard around them. That would demonstrate interface design, but it wouldn’t fully represent the engineering required to connect an HMI to real equipment.
Instead, we decided to use our own workspace.
Our computers, monitors, keyboards, mice, and other peripherals are the equipment we use to produce our work. They provide information about their identity, configuration, operating state, and performance. Much like equipment on a manufacturing floor, that information can be collected, organized, and presented through a monitoring interface.
That concept became the foundation for Workspace Explorer, an HMI demonstration built around our everyday working environment. To make it possible, we first needed to acquire the data. That’s where Workspace Collector comes in.
Turning a Workstation into a Data Source
Industrial automation systems rarely receive all their information through a single interface. Depending on the equipment, data might be available through PLC communications, device-specific protocols, network services, or software APIs. A modern Windows workstation presents a surprisingly similar integration challenge.
Different devices expose information through different interfaces, and not every device provides the same level of access. Some report detailed performance metrics, while others expose only identification information or a limited set of operating values.
Workspace Collector is a Windows-based Python application developed to bring those different sources together. Its collection capabilities include:
- Computer hardware: System identification and available performance telemetry obtained through LibreHardwareMonitor.
- Monitors: Display identification and supported controls or readings through Windows interfaces and DDC/CI.
- Mouse: Device information and supported values obtained through Logitech HID++ communication.
- Keyboard: Identification and availability information for the configured Keychron keyboard.
- Headphones: Bluetooth advertisement information from supported Beats hardware.
Each hardware category presents different communication requirements. Rather than expecting every device to conform to a common protocol, Workspace Collector uses dedicated interfaces to retrieve the information each source makes available. This reflects a familiar challenge in industrial automation: integrating equipment and systems that were not necessarily designed to communicate with one another.
Separating Data Acquisition from Data Presentation
Workspace Collector was developed as a supporting component of Workspace Explorer, not as a standalone monitoring product. Its responsibility is to collect available device information, organize that information into a consistent structure, and publish it for downstream use.
Workspace Explorer can then focus on presenting the information and providing an interactive user experience. This separation keeps hardware-specific communication details outside the HMI layer. Changes to a device interface can be addressed within the collection application without necessarily requiring changes to the visualization itself.
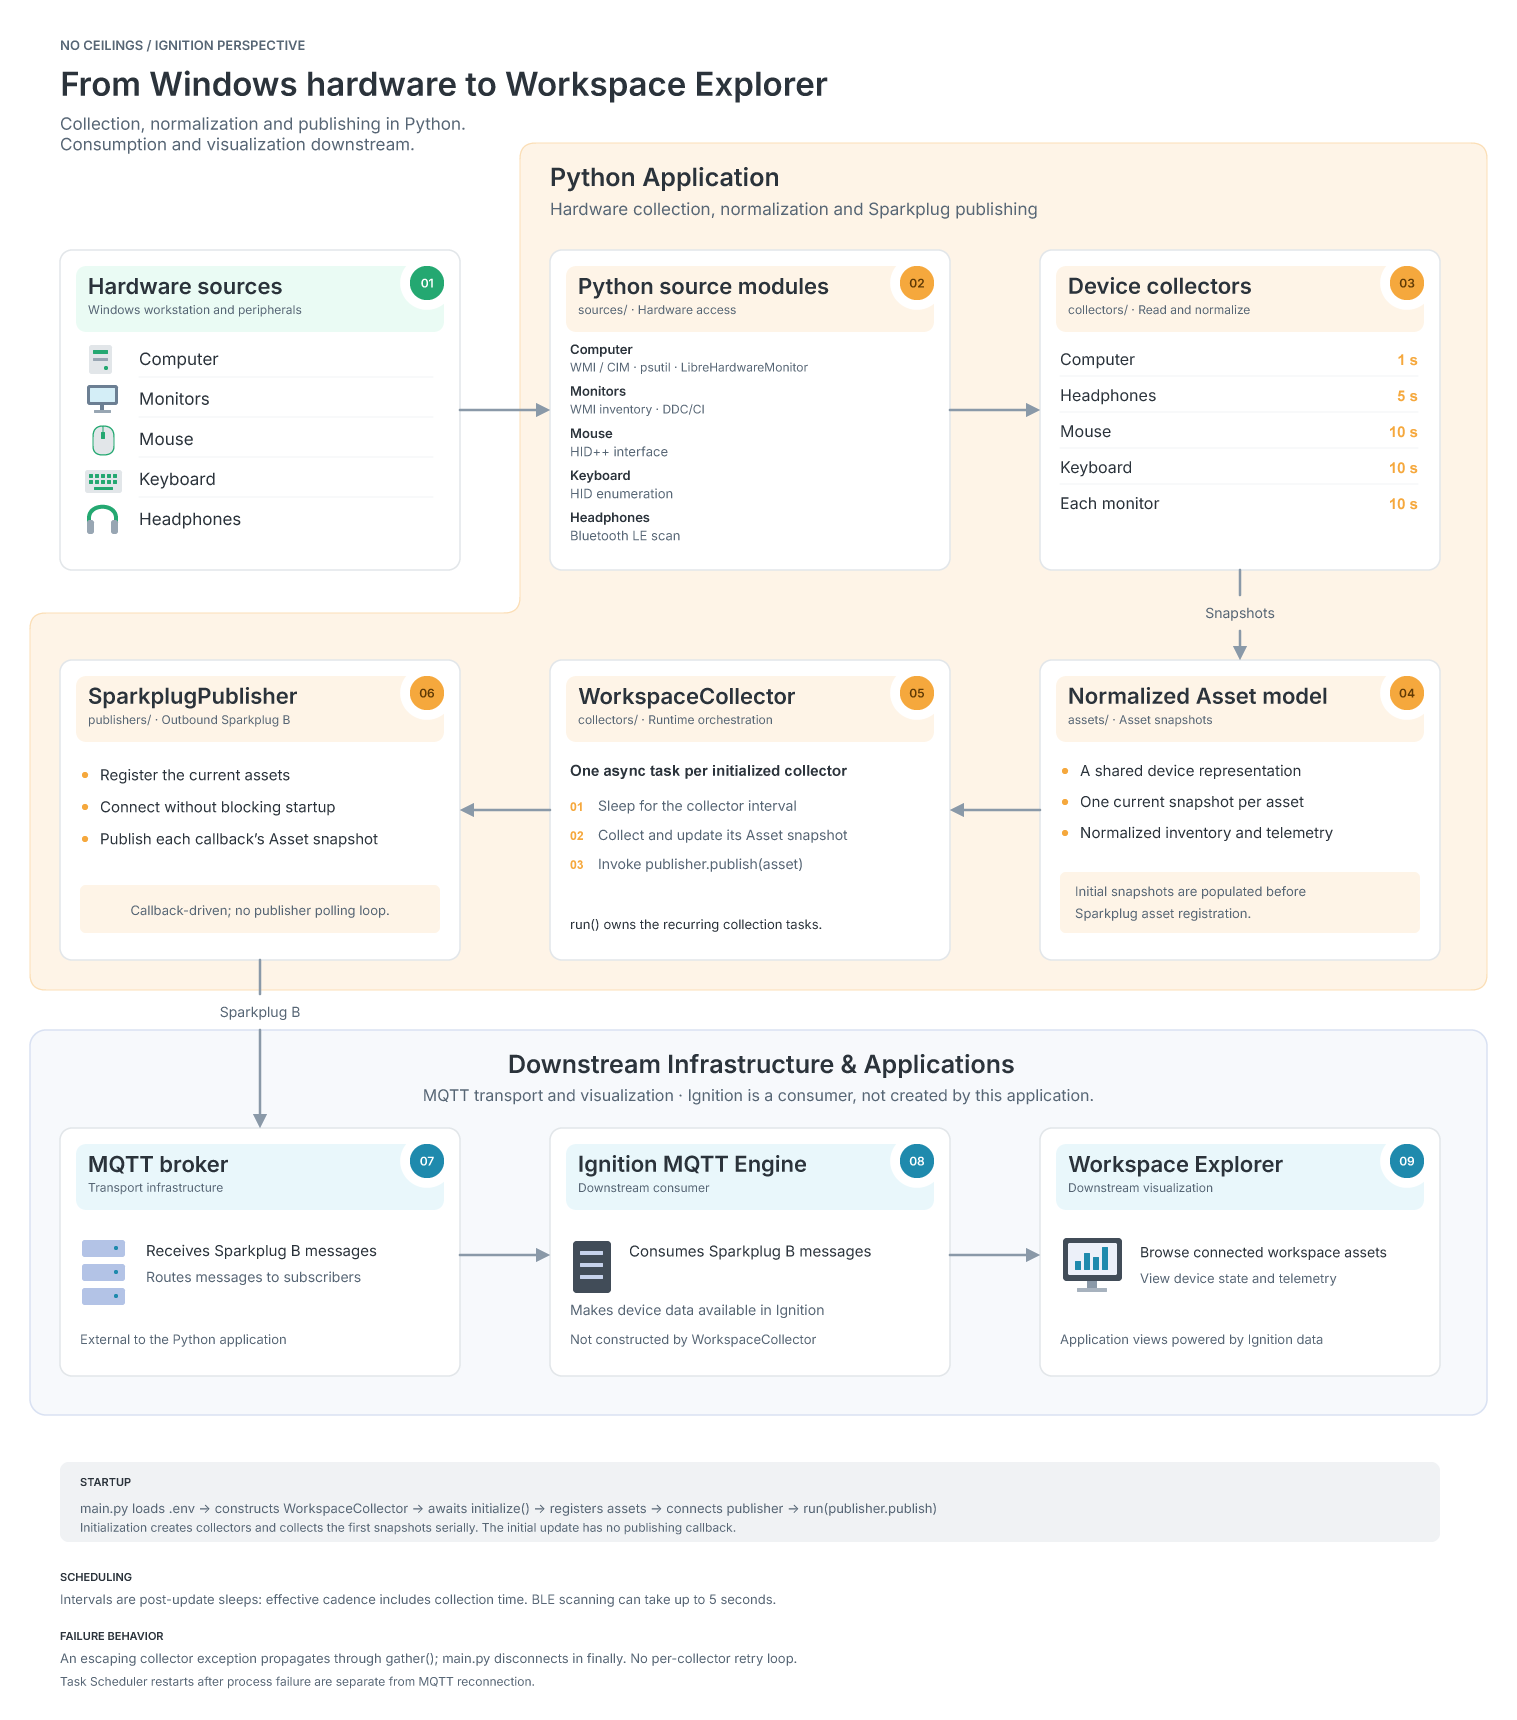
Workspace Collector System Architecture
An overview of the data flow from Windows hardware and device-specific collectors through a normalized asset model to MQTT Sparkplug B.View Image
Creating a Common Asset Model
One of the challenges in collecting information from different hardware devices is deciding how that information should be represented. A monitor might expose brightness and display identification, while a computer reports processor utilization, memory usage, and temperature readings. Those values are different, but they still describe identifiable assets with properties and operating conditions.
Workspace Collector addresses this through a shared Asset class.
class Asset(object):
    def __init__(self, assetId):
        self.assetId = assetId
        self.identity = {}
        self.metadata = {}
        self.configuration = {}
        self.state = {}
        self.telemetry = {}
Every supported device uses the same five information categories:
- Identity: Information that identifies the asset.
- Metadata: Descriptive information about the device.
- Configuration: Available settings and configuration properties.
- State: Current operating conditions or status.
- Telemetry: Measured values and performance information.
Individual collectors populate the categories appropriate for their devices. This creates a consistent information model without requiring every device to expose identical data.
It also simplifies downstream integration. Instead of requiring the publishing layer to understand the internal details of Logitech HID++, Windows hardware APIs, or monitor DDC commands, it can work with a common asset structure. The same principle applies to industrial automation, where equipment from different manufacturers often needs to be represented within a unified monitoring system.
Coordinating Data Collection
Not all hardware information changes at the same rate. Computer utilization can fluctuate rapidly, while a monitor’s configuration or a device’s identification information may remain unchanged for extended periods.
Workspace Collector accounts for this by assigning collection intervals to individual collectors rather than polling every device through one global cycle. The application uses Python’s asyncio framework to coordinate these collection tasks.
async def _runCollector(
    self,
    assetId,
    collector,
    onUpdate=None,
):
    while True:
        await asyncio.sleep(
            collector.interval
        )
        asset = await self._updateCollector(
            assetId
        )
        if asset is not None and onUpdate is not None:
            onUpdate(asset)
Each collector follows its configured interval, retrieves an updated asset snapshot, and passes that snapshot to a callback. In Workspace Collector, the callback connects the acquisition process to the Sparkplug B publisher.
The collectors are scheduled as separate asynchronous tasks, allowing the application to coordinate their execution independently. Some underlying hardware operations remain synchronous, so this approach should not be confused with fully nonblocking hardware communication.
Integrating with Industrial Systems Using MQTT Sparkplug B
Collecting the data was only part of the challenge. We also needed to make that information available to an industrial HMI platform. For Workspace Explorer, we chose MQTT with Sparkplug B, using Ignition as the downstream industrial software platform.
MQTT provides a publish-subscribe messaging mechanism, while Sparkplug B defines conventions for organizing industrial data, identifying devices, representing metrics, and managing communication state. Workspace Collector uses the Python pysparkplug library to implement its publishing functionality.
The application establishes a Sparkplug Edge Node and registers each collected asset as a Sparkplug device. The asset’s information is then represented as metrics associated with that device.
From Python Objects to Sparkplug Metrics
The publisher translates normalized asset information into a structure suitable for Sparkplug B. This involves flattening nested asset properties into metric names, determining appropriate data types, and maintaining the metric definitions associated with each registered device.
The publisher also maintains a cache of previously published values. When an updated asset snapshot arrives, the publisher compares the new values against its cached state and identifies which metrics have changed. If nothing has changed, there is no need to publish another update. When values have changed, the publisher creates metrics for those values and submits the update through the Sparkplug Edge Node.
This reduces unnecessary repeat publications while allowing the collectors to continue operating at their configured intervals.
Managing Changes to Device Metrics
A device’s available information isn’t necessarily static. Hardware availability, collection results, or changes in supported properties can alter the metrics associated with an asset.
Workspace Collector maintains a schema for each registered Sparkplug device. When an updated asset no longer matches its previous schema, the publisher deregisters and re-registers that device using the updated metric definitions.
This distinguishes between a metric value changing and the structure of a device’s published information changing. Accounting for both allows the publisher to accommodate changes in the information exposed by collected assets.
Sparkplug B Data in Ignition
Workspace Collector device information represented as Sparkplug B metrics in Ignition.View Image
Engineering Challenge: When the Data Only Publishes Once
One of the more interesting problems encountered during development involved the Sparkplug B connection itself. Initially, Workspace Collector successfully established communication and published its device data. From the perspective of the MQTT integration, everything appeared to be working.
However, there was a problem: the data only published once. Subsequent changes to the collected hardware values were not appearing as ongoing updates.
The solution was found in the connection behavior of the Sparkplug B library. By explicitly setting blocking=False when establishing the connection, the application was able to continue its asynchronous collection and publishing workflow.
self.edgeNode.connect(
    self.host,
    port=self.port,
    blocking=False,
)
It was a small change, but an important one. The issue demonstrated why successful initial communication isn’t enough to validate a continuously operating monitoring system.
An application might successfully establish a connection, register its devices, and publish initial values while still failing to deliver the continuous updates expected from a monitoring system. In this case, changing the connection behavior resolved the observed issue.
The exact internal mechanism responsible for the original behavior has not been independently established. What the development experience demonstrated was the importance of understanding how a communication library’s connection behavior interacts with the rest of an application’s execution model.
For systems intended to operate continuously, verifying the complete data lifecycle is just as important as verifying the initial connection.
Working with Hardware-Specific Limitations
Unlike a controlled demonstration where every device returns predictable values, real hardware introduces variations and limitations. A device might support identification but not detailed telemetry. A monitor may expose DDC/CI controls, but communication behavior can vary between displays. Bluetooth advertisement data may be available without providing a complete picture of a device’s operating state.
Workspace Collector addresses these differences through dedicated source modules and device-specific collectors. The source modules handle hardware communication, while the collectors translate the available information into the shared asset structure. This division helps keep device-specific implementation details from spreading throughout the application.
For example, the monitor integration uses Windows display discovery alongside DDC communication where available. The application also supports excluding configured monitor serial numbers from DDC access. These accommodations are part of working with actual hardware rather than assuming that every device behaves consistently.
Workspace Collector is not intended to be a universal hardware monitoring system. It is a deliberately scoped integration project built around the devices and interfaces available in our working environment.
From Workspace Collector to Workspace Explorer
Workspace Collector provides the data acquisition foundation for the larger Workspace Explorer demonstration. By publishing normalized device information through Sparkplug B, it makes real workstation data available to Ignition, where that information can support HMI visualizations and interactions.
The broader project also includes InteractionDetails, another supporting component developed to enable the intended user experience. Together, these components demonstrate more than interface design.
They show how a monitoring application can be developed from the underlying data sources upward: identifying available information, developing communication interfaces, organizing the data, integrating it with an industrial platform, and ultimately presenting it to the user.
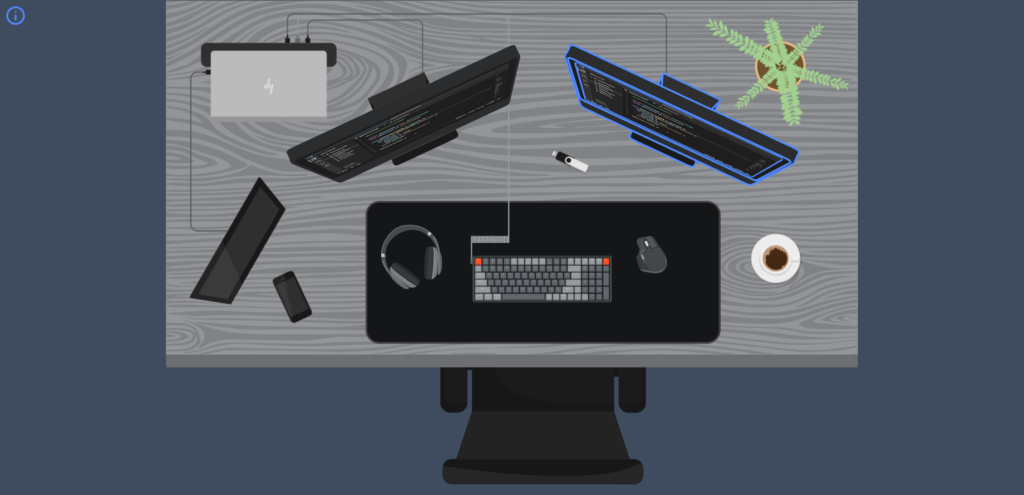
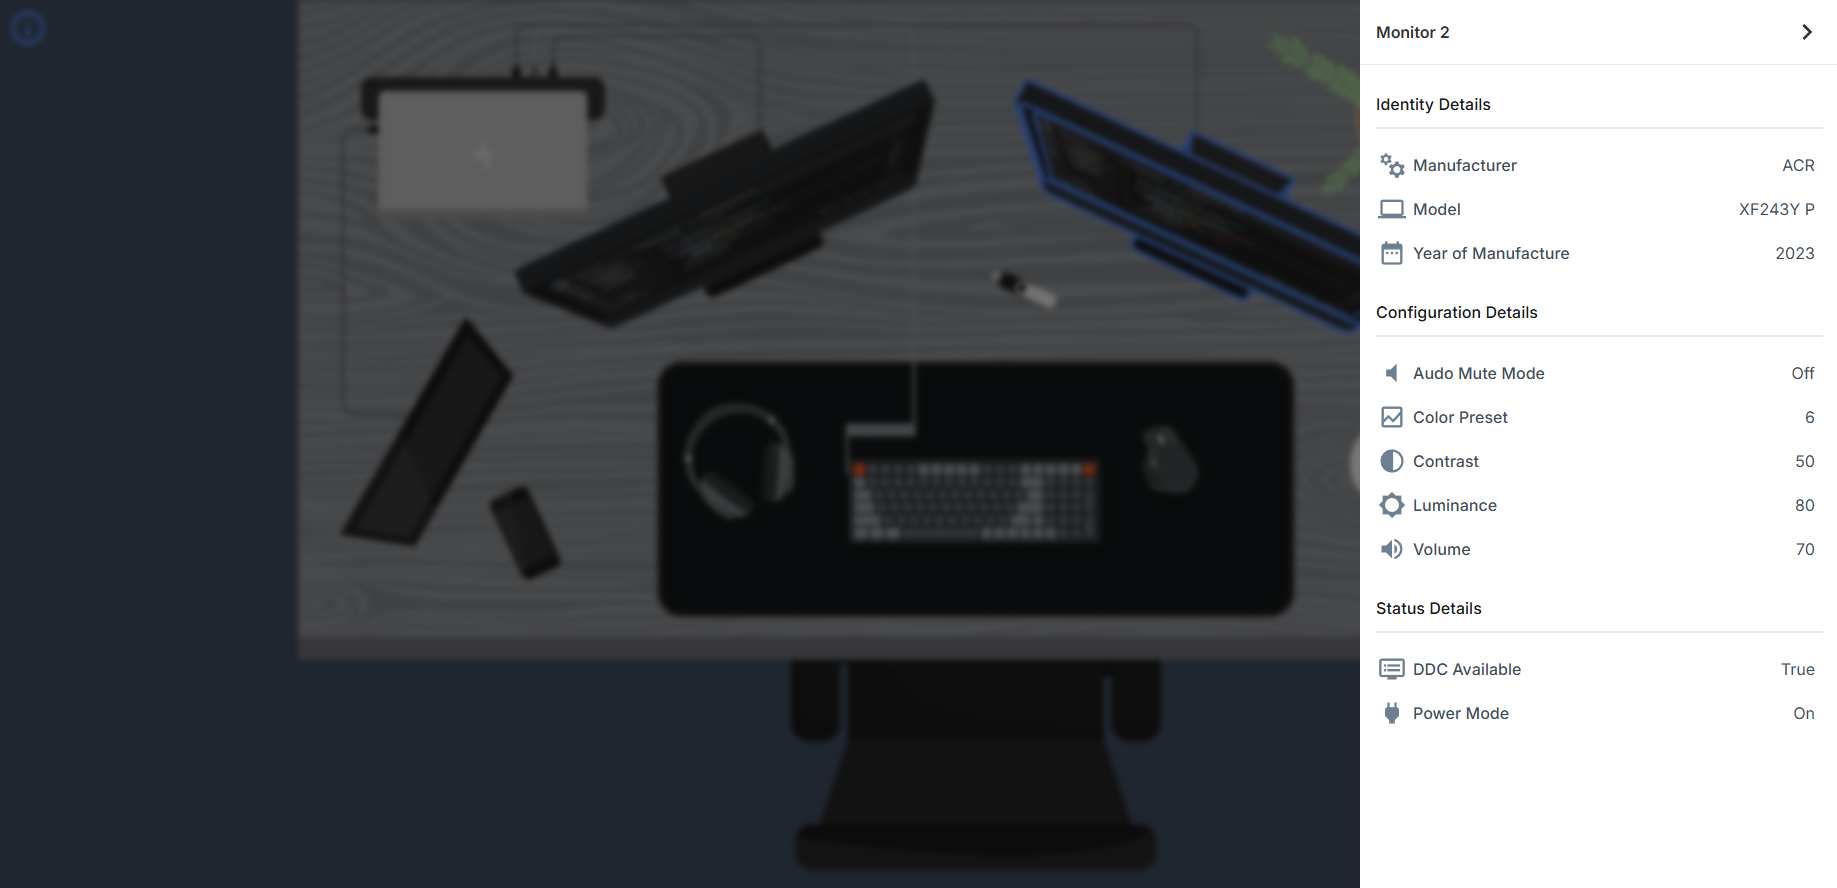
Workspace Explorer HMI
Workspace Explorer displaying workstation information collected through Workspace Collector and integrated with IgnitionDevice Details and Telemetry
Selecting an asset reveals its available properties, configuration, connection status, and live telemetry, demonstrating how Perspective can combine interactive graphics with detailed device information.What This Project Demonstrates
Workspace Collector began with a practical requirement: we wanted to build an HMI demonstration around meaningful data from equipment we actually use. Meeting that requirement involved several engineering disciplines commonly encountered in industrial automation projects:
- Developing interfaces to different hardware and software data sources.
- Normalizing inconsistent information into a common asset model.
- Coordinating independently scheduled collection tasks.
- Integrating collected data through MQTT Sparkplug B.
- Managing metric updates and changes to published device schemas.
- Troubleshooting communication behavior across application and integration boundaries.
The hardware in this project happens to sit on a desk rather than a factory floor. The underlying integration challenges, however, have clear parallels with industrial data acquisition and supervisory systems.
That is what makes Workspace Collector useful as a technical demonstration. It shows the work behind the interface: where data comes from, how it is structured, how it moves between systems, and how engineering decisions affect the operation of the overall solution.
Building Solutions Around Real Data
At No Ceilings, we approach HMI development as more than arranging values on a screen. A useful monitoring interface depends on the systems behind it: reliable data acquisition, thoughtful information modeling, appropriate communication technologies, and an understanding of how the resulting information will be used.
Workspace Collector demonstrates that approach on a smaller, familiar scale.
If you’re developing an industrial monitoring system, integrating equipment data, or exploring how existing information can be made available through an HMI, we’d be happy to discuss your requirements.