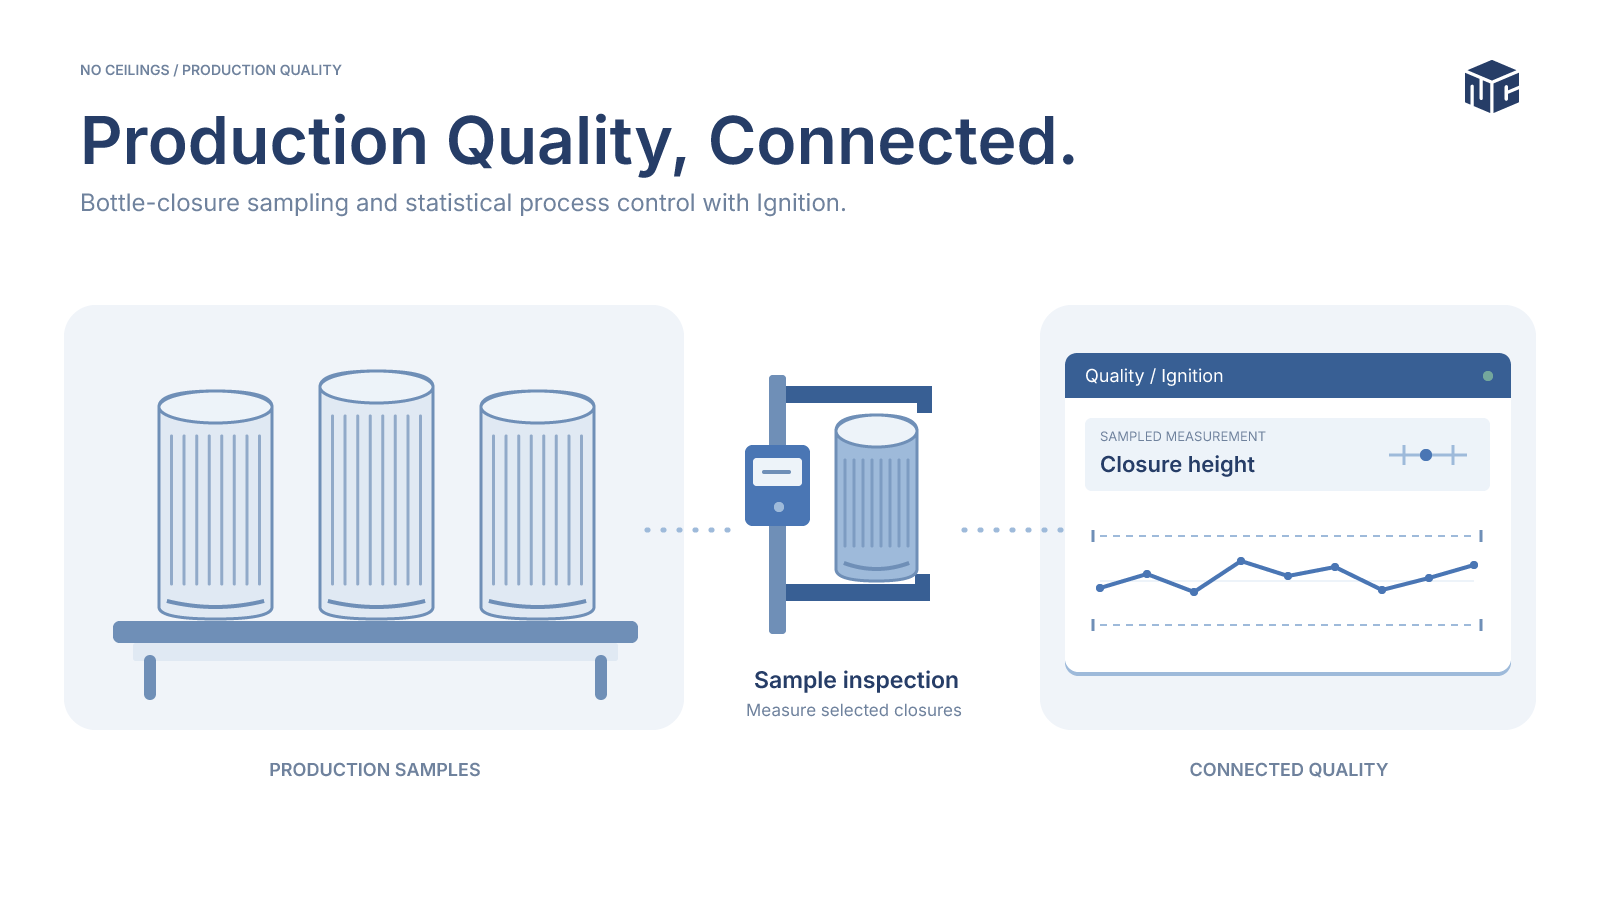
A bottle-closure manufacturer needed a consistent way to check production quality across multiple products and manufacturing locations. The work involved more than displaying a measured value beside a tolerance. Every result needed the right product, test, sampling definition, and location context so that operators could interpret it against the appropriate requirements.
An Ignition application built around the Sepasoft SPC module brought these activities together: sample collection, specification management, statistical analysis, operator response, and quality reporting.
The production challenge
The manufacturing environment included drawn caps and compression-molded caps, with sampling locations associated with pressing, lining, and other production steps. Different products and tests required different limits and collection rules. A measurement without that context could not reliably support a quality decision.
The application therefore treated quality data as a structured production record. Product codes, locations, sampling definitions, and test attributes identified what was being measured. Additional factors such as lot, case, and shift information supplied further context where configured.
The production model organized collection points beneath the manufacturing hierarchy. A sampling location identified where a sample was taken and measured, while its sampling definition established the tests to perform. This made the location meaningful to both the operator entering the result and the quality personnel reviewing it later.
For a manufacturer running different closure families, that separation matters. The same type of measurement can appear in more than one production context, and a product change can alter the applicable requirements. The application needed to preserve those relationships rather than rely on an operator remembering which limits belonged to the current job.
Connecting specifications to production
Product lifecycle management supplied control-plan information, instructions, and specification limits. Database integration linked product families to individual product codes and made the applicable limits available to the SPC application. Updates also had to account for sampling definitions created after product specifications were received.
This relationship was central to the implementation. The application needed to associate each limit with the correct product, location, sampling definition, attribute, and chart context. Consistent configuration made it possible to reuse the quality workflow across production locations without treating every test as an isolated screen.
The specification interface had to handle two sequences: specifications arriving for an existing sampling definition, and a new sampling definition being configured after its specifications were already available. Database routines reconciled the product-family relationships and updated the corresponding limit records. This kept specification maintenance connected to the application configuration rather than treating the initial import as a one-time task.
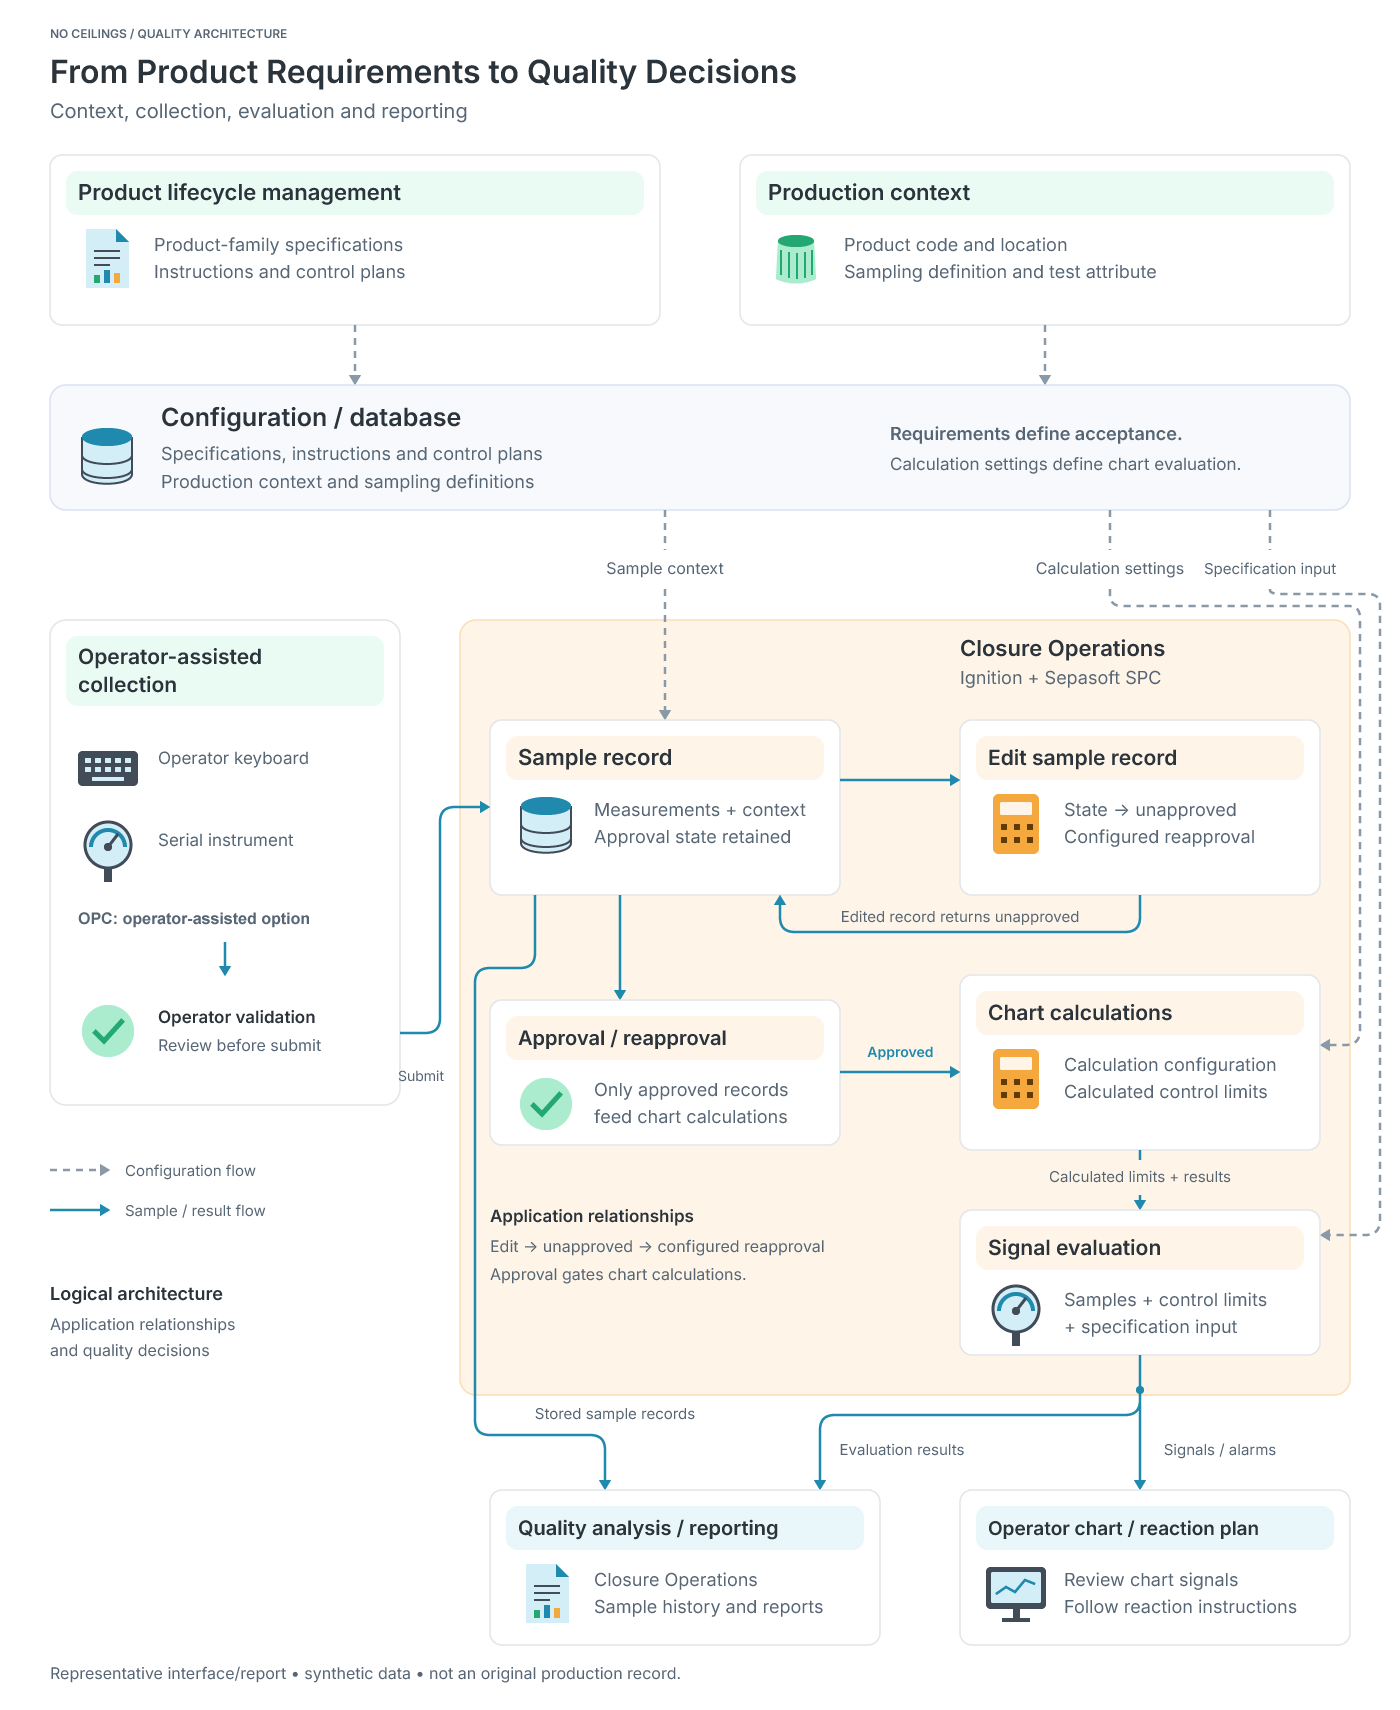
From Product Requirements to Quality Decisions
Context, collection, evaluation and reporting.View Image
Specification limits and control limits
Specification limits described the acceptable bounds for a product characteristic. Statistical control limits served a different purpose: evaluating process behavior using the configured analysis. The application handled these separately, supporting both out-of-specification checks and out-of-control signals.
The configured analysis included individual and subgroup charts, range and variation calculations, capability and performance calculations, and pattern-based signals. Rather than creating a new SPC module, the work configured and extended an existing module to fit the production requirements.
A result can fall inside the product specification while still contributing to a statistical signal that deserves investigation. Conversely, a process that behaves consistently can still be producing values outside a required tolerance. Presenting both types of limits helped keep product conformance and process behavior distinct.
A calculation example: individual control limits
The individual-chart calculation uses the average of sequential measurements and their average moving range. This Python-style pseudocode explains the relationship with descriptive variable names. It is not executable Ignition code, and its helper names do not represent platform APIs.
require at least two valid, consecutive measurements
require a suitable process baseline

process_center = average(measurements)
step_changes = absolute differences between consecutive measurements
mean_step_change = average(step_changes)

lower_process_limit = process_center - 2.66 * mean_step_change
upper_process_limit = process_center + 2.66 * mean_step_change

return process_center, lower_process_limit, upper_process_limit
The coefficient applies to this individual-chart method using moving ranges of two adjacent observations. It is not a universal factor for all chart types. Missing observations and baseline selection need deliberate treatment rather than silently joining unrelated measurements. Product specification limits remain separate inputs from the product requirements.
Collecting measurements at the point of work
Operators could enter test results manually or use instrument-assisted collection workflows. The application included keyboard entry, operator-validated OPC and RS-232 paths, and calculated attributes. The relevant collection method depended on the test and instrument configuration.
Fully automatic OPC collection was not configured for this implementation. Operator participation remained part of the measurement workflow, allowing readings and sample context to be reviewed before submission.
Instrument-assisted entry also needed a practical interaction sequence. A reading could be presented to the operator before being accepted, keeping the measurement associated with the active test. Keyboard entry served tests that required manual input, while calculated attributes supported results derived from other values.
The serial instrument path required configuration appropriate to the instrument, including communication settings and interpretation of the returned data. A physical connection alone did not establish a usable measurement. The application had to identify the value in the instrument output and place it in the correct sample context.
Checking plausibility before accepting a result
Measurement entry included reasonable-limit checks where configured. These checked whether an entered value was plausible before it was accepted. They served a different purpose from product specification limits and statistical control limits. A plausible reading could still be outside specification, and an in-specification reading could still contribute to a process signal.
Entry screens also brought test instructions into the measurement workflow. Boolean results, numeric readings, and calculated attributes could use different input paths while retaining the relevant test and location context.
Calculated attributes with visible inputs
Some results were derived from other measured attributes. A configurable formula editor allowed attribute references to be inserted into a calculation. The measurement screen displayed the original formula, its substituted values, and the calculated result, making the relationship visible to the operator.
The following pseudocode summarizes that workflow. It deliberately leaves the formula engine abstract rather than reproducing a historical execution mechanism.
calculation_rule = selected test formula
required_inputs = attribute references in calculation_rule

if any required input is unavailable:
    request the missing measurement
else:
    resolved_rule = substitute current sample values
    derived_result = evaluate the configured rule
    display calculation_rule, resolved_rule, derived_result
    validate derived_result against configured reasonable limits
    accept through the configured saving workflow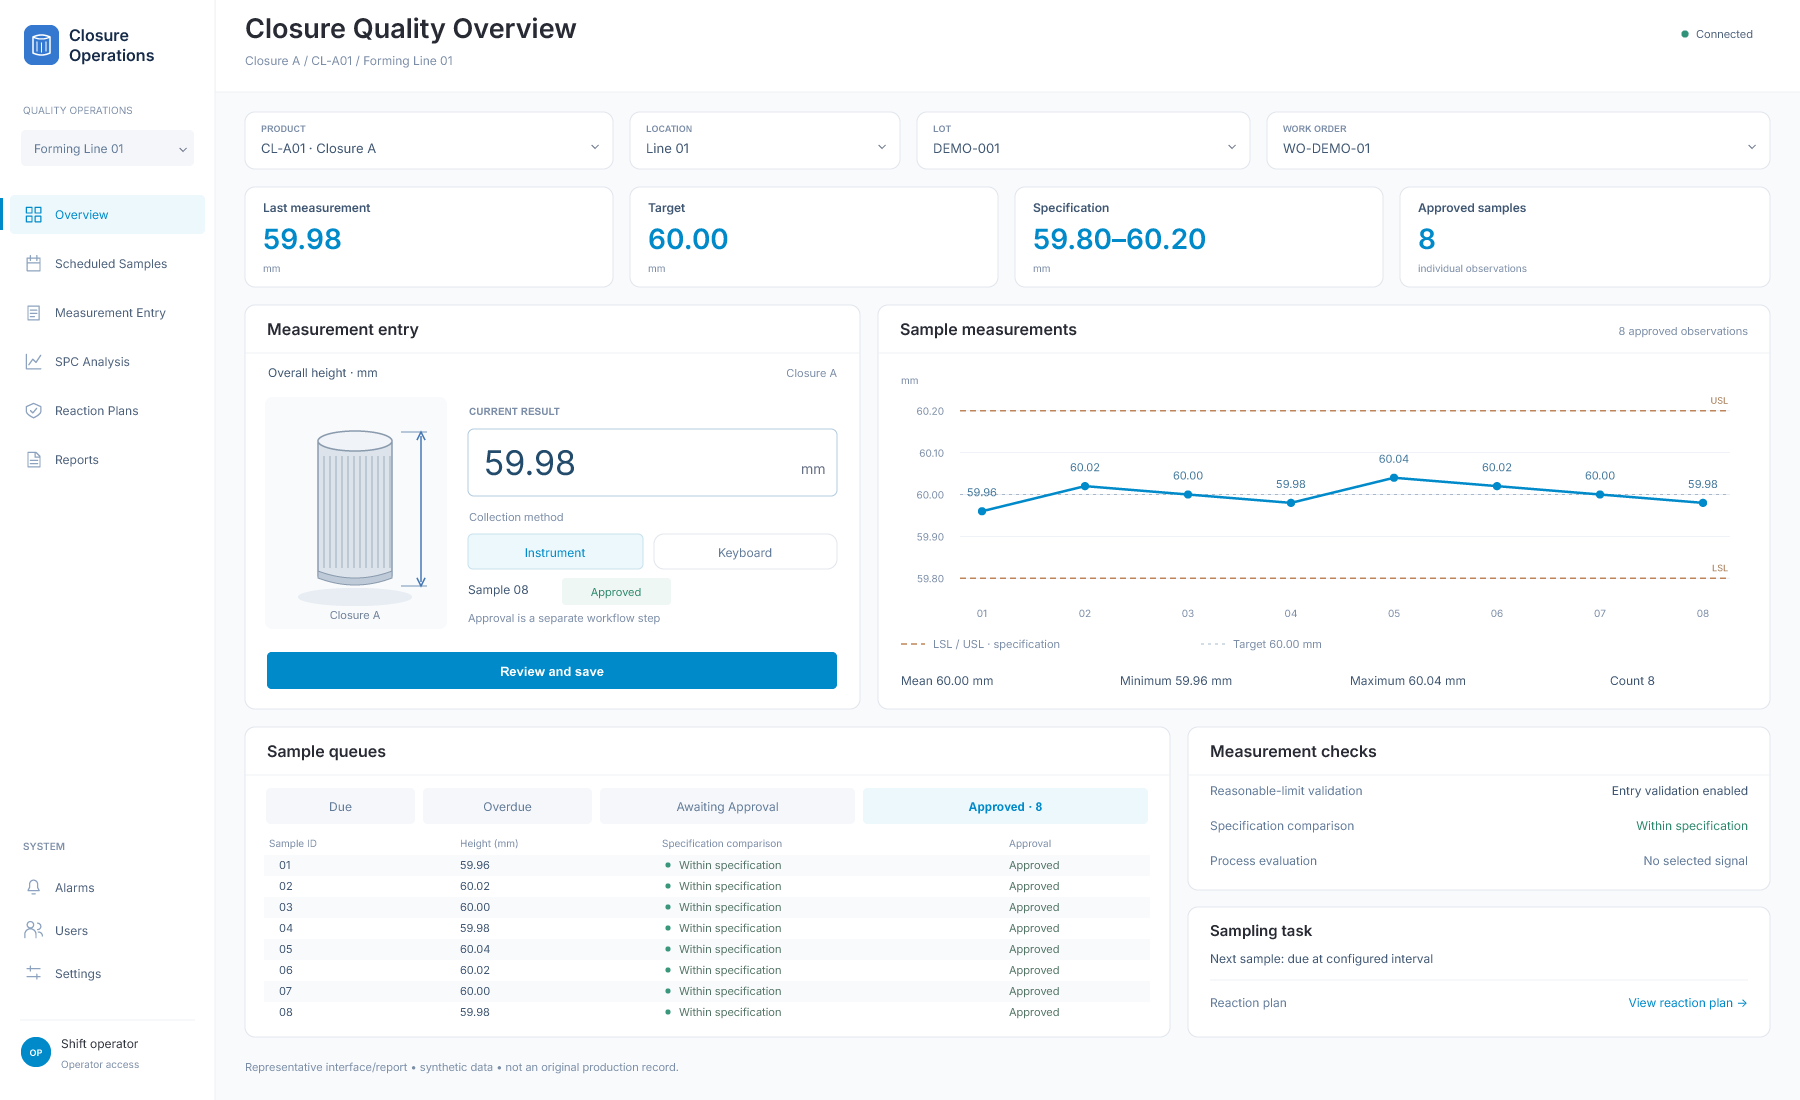
Closure Quality Overview
Operator workspace bringing production context, measurement entry, and sample approval into one quality-control interface.View Image
Managing the sample lifecycle
The production interface separated samples into four queues: due, missed or overdue, awaiting approval, and approved. These queues gave operators a view of the work still required as well as the measurements already completed.
Scheduled samples existed before their measurement values were entered. The scheduler created the sample record, and the operator added results against that record. Ad-hoc sampling provided a separate route for checks initiated outside the schedule, carrying the current production context into the entry screen.
Approval was configurable. With automatic approval enabled, a sample was approved when saved. Otherwise, it remained available for manual review. Unapproved samples were excluded from charts and statistical calculations, so saving a measurement and admitting it into analysis were distinct steps.
Scheduling could vary by location and sampling definition. Configuration included production-start and production-end events, shifts, running time, minimum-sample settings, and small-batch options. This allowed collection requirements to follow production activity rather than relying only on a fixed timer.
Turning analysis into an operator response
Sample evaluation was connected to alarm handling and reaction-plan presentation. Application logic translated SPC events into alarm states and supplied test and location context for the operator response. This connected statistical evaluation with the practical question of what needed attention on the production floor.
Sampling schedules were also configurable around production activity, including timing and production-event options. Configuration and sample-management tools supported quality personnel, while the production interface focused on collecting scheduled results and reviewing their status.
The alarm logic preserved the location, signal, sampling definition, and attribute that produced an event. That combination distinguished one quality condition from another and provided a basis for identifying the corresponding alarm state. Reaction information was selected using the test and production location, making the response relevant to the measurement under review.
The operator and configuration interfaces served different tasks. Production personnel needed a focused route to the current sample and its result. Quality personnel needed access to sampling definitions, locations, attributes, analysis, and historical sample management. Keeping these responsibilities distinct reduced the amount of configuration detail required at the point of measurement.
Correcting samples while preserving context
Quality personnel could review and edit sample values together with notes, causes, and associated history. The editing workflow temporarily unapproved a sample, removing it from charts and calculations while changes were made. Approval on saving followed the sampling definition configuration.
The sample review interface presented notes, causes, and change-history information alongside the measurement. This supported investigation and correction without treating a revised number as an isolated replacement. These functions provided application-level traceability without implying a particular regulatory certification.
Quality review and reporting
The application included certificate-of-analysis workflows with filters for production and product context. Users could review report data before export, with spreadsheet output and a separate report workflow supporting printable and exported documents.
Reporting extended the value of the sample records beyond the immediate operator check. The same contextual data used for SPC could support a structured quality review instead of requiring a separate, disconnected record of the measurements.
The reporting workflow allowed selection by production and product context, including line, date range, product or test selections, and work-order or lot information in the applicable report. The spreadsheet workflow presented the assembled data for review before export. A separate report layout supported formatted output with fields for comments and approval information.
A certificate-of-analysis view is most useful when the result can be traced back to its production context. The implementation connected reporting with the quality records instead of treating the report as a free-form document. The report layout and filtering were application functions. They did not, by themselves, establish an external certification or regulatory approval.
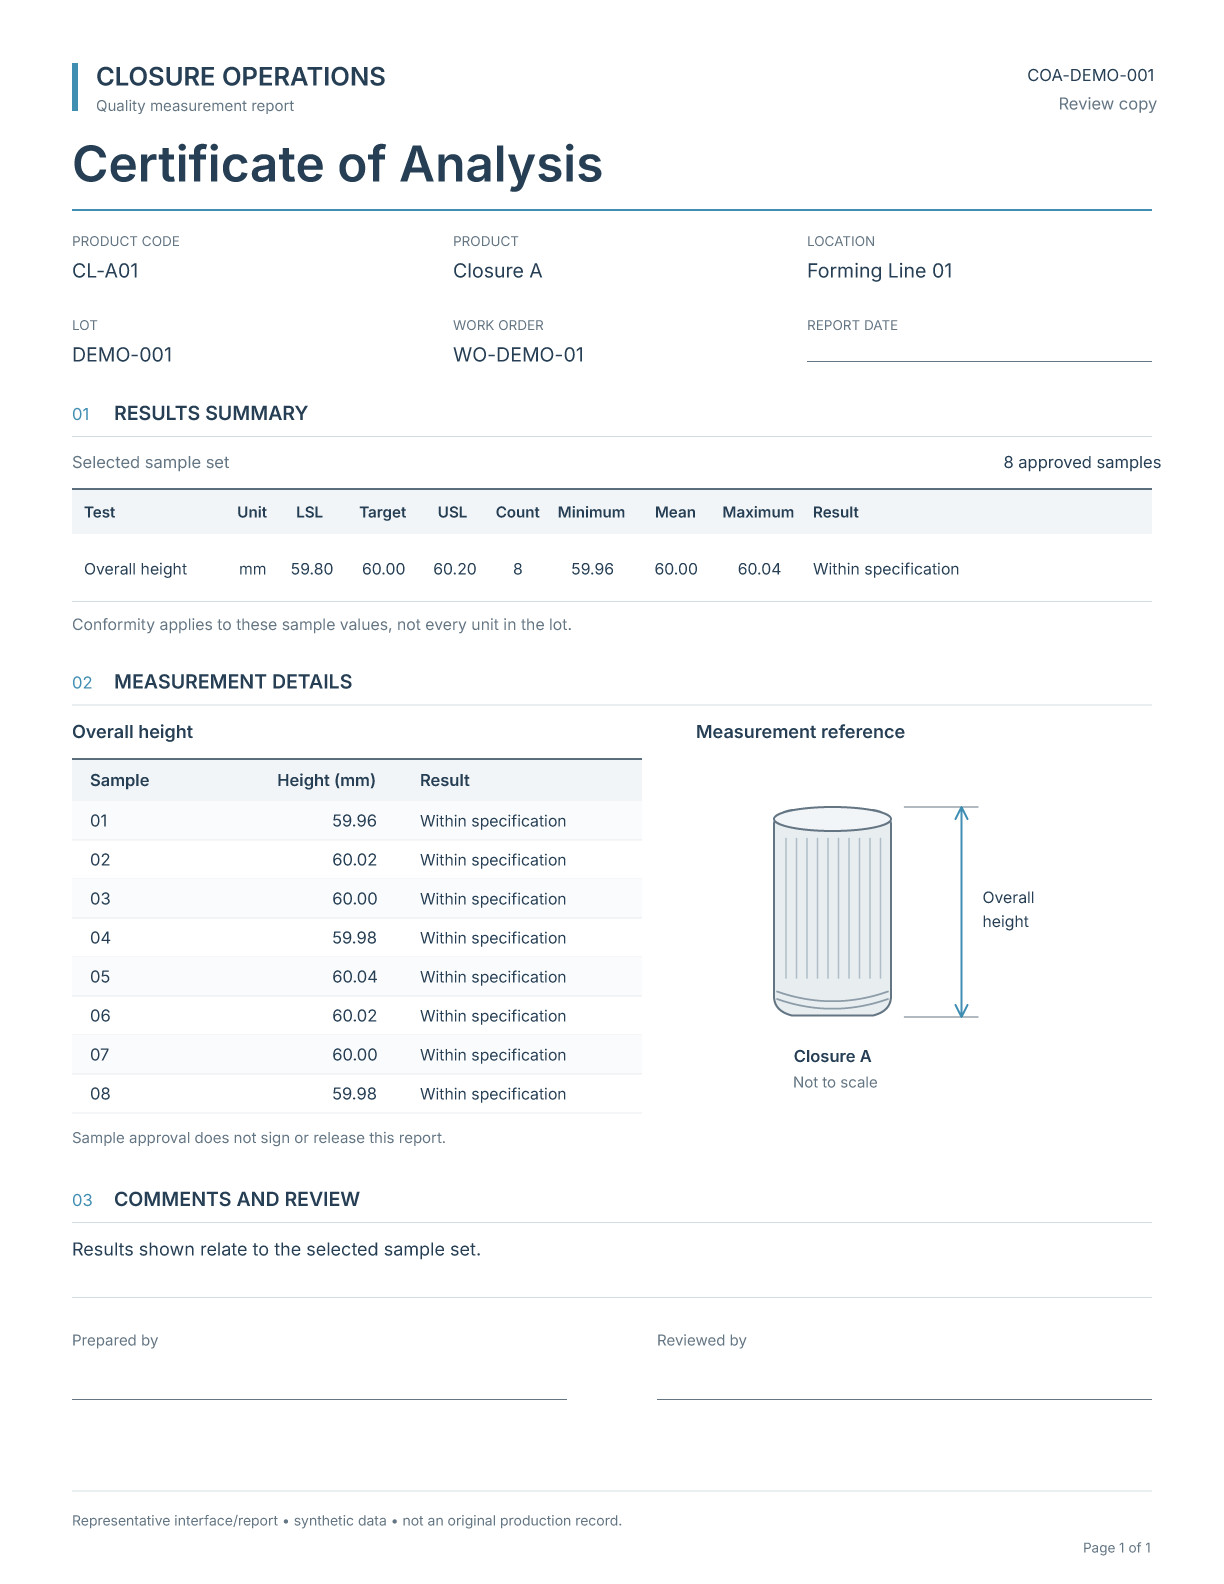
Certificate of Analysis
Summarizing approved sample measurements against product specifications, with production context for quality review.View (PDF)
What the implementation established
The implementation brought product-specific requirements, sample collection, configured statistical calculations, alarms, and reporting into one Ignition-based quality application. Its contribution was the connection between those functions: a production measurement could be associated with its requirements, evaluated, reviewed, and carried into a quality report.
The engineering lesson is to establish the meaning of a sample before building the chart. Product identity, sampling context, measurement method, and limit selection determine whether the resulting analysis is useful to operators and quality personnel.
Planning an industrial quality or production-data application? Discuss your requirements with No Ceilings.